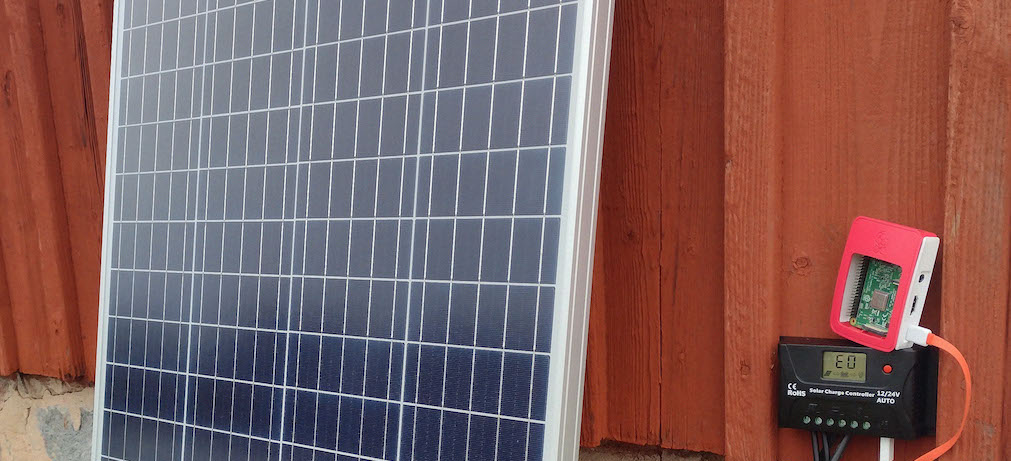
Creating and testing solar powered servers. From small off-grid setups using Arduino and Raspberry Pi, to on-grid full size servers with self-adapting behavior.
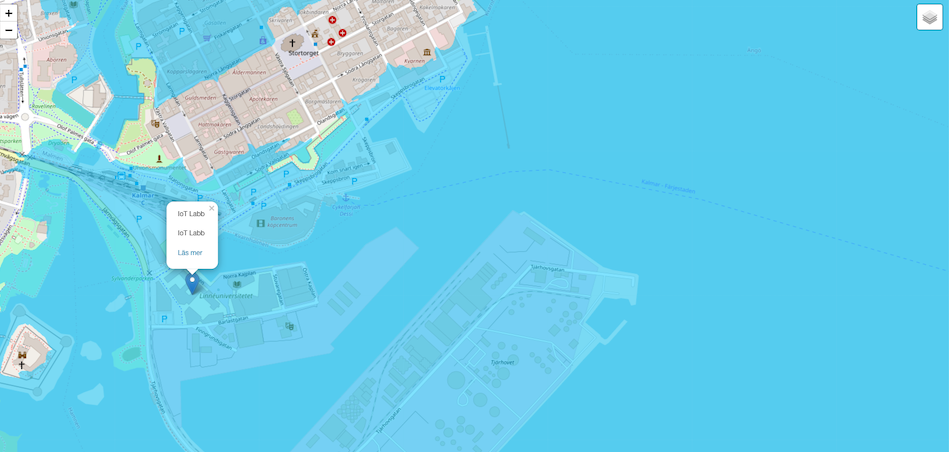
Developing web and GIS services for climate adaptation under uncertainty in urban planning.
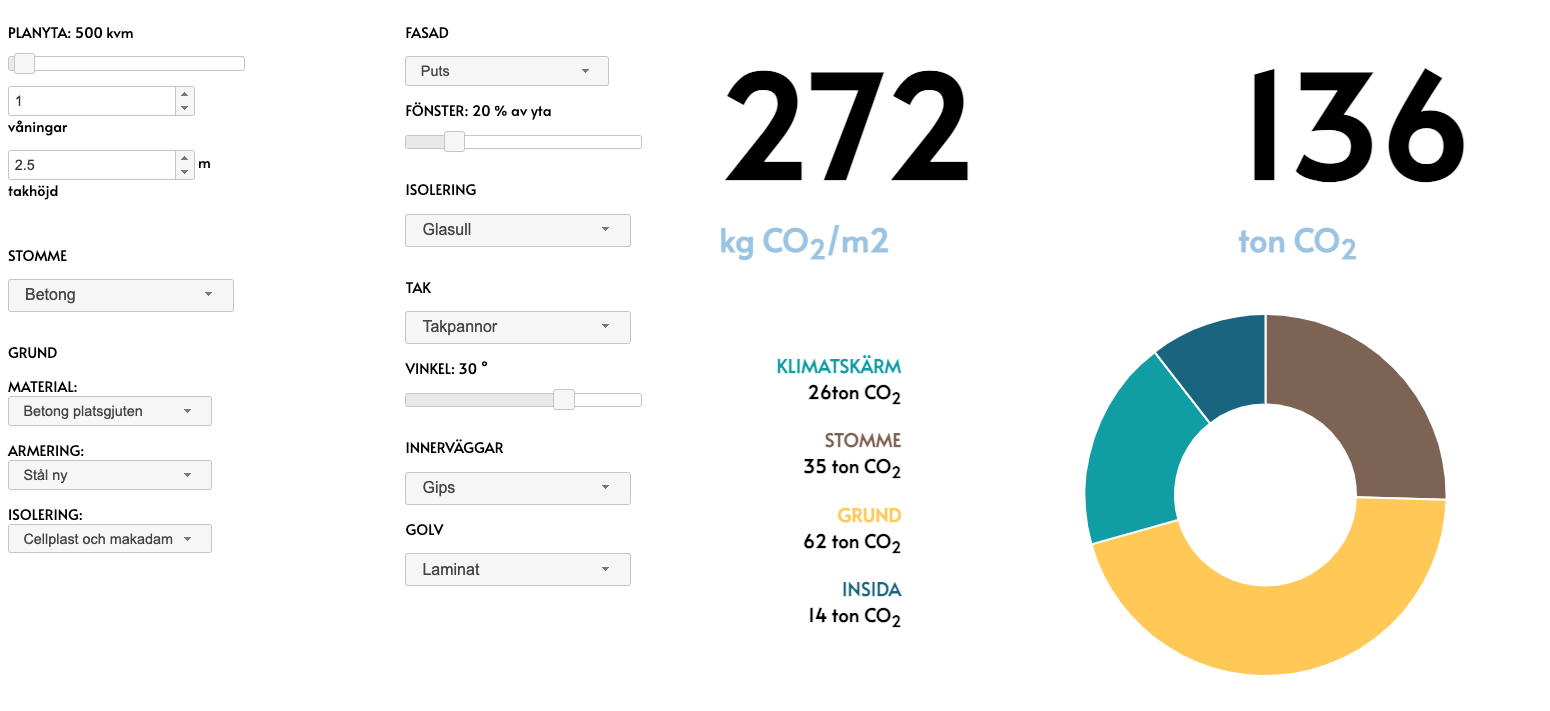
Exploring how data and visualisation can be used for better decision making for achieving climate neutrality in the built environment, together with Växjö Municipality.
Undestanding and supporting new energy practices adapting to dynamic energy availability (solar panels) and price (spot price).
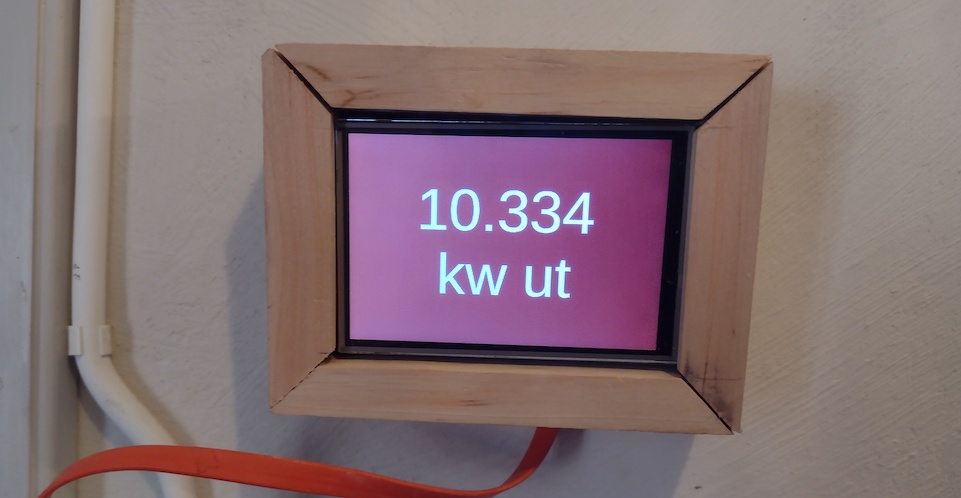
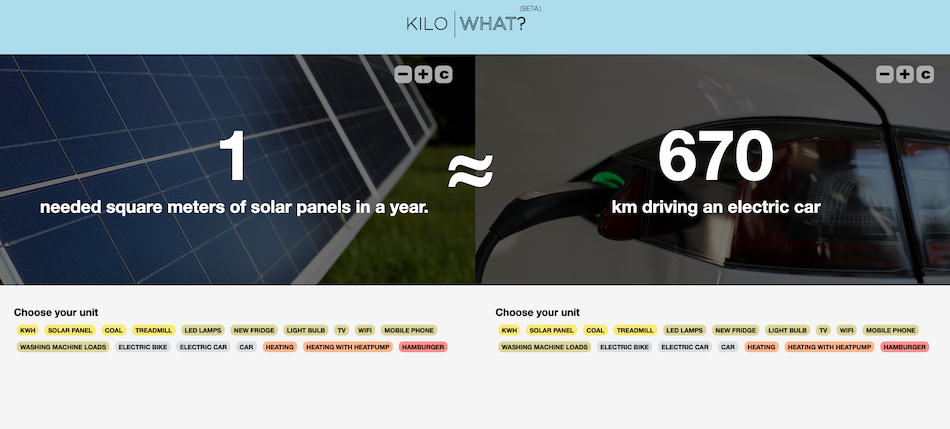
Kilowhat? is a new iteration of carbon.to focusing in kilowhat hour information. Together with Björn Hedin we investigated how the interactivity could improve the learning effect for increasing energy literacy.
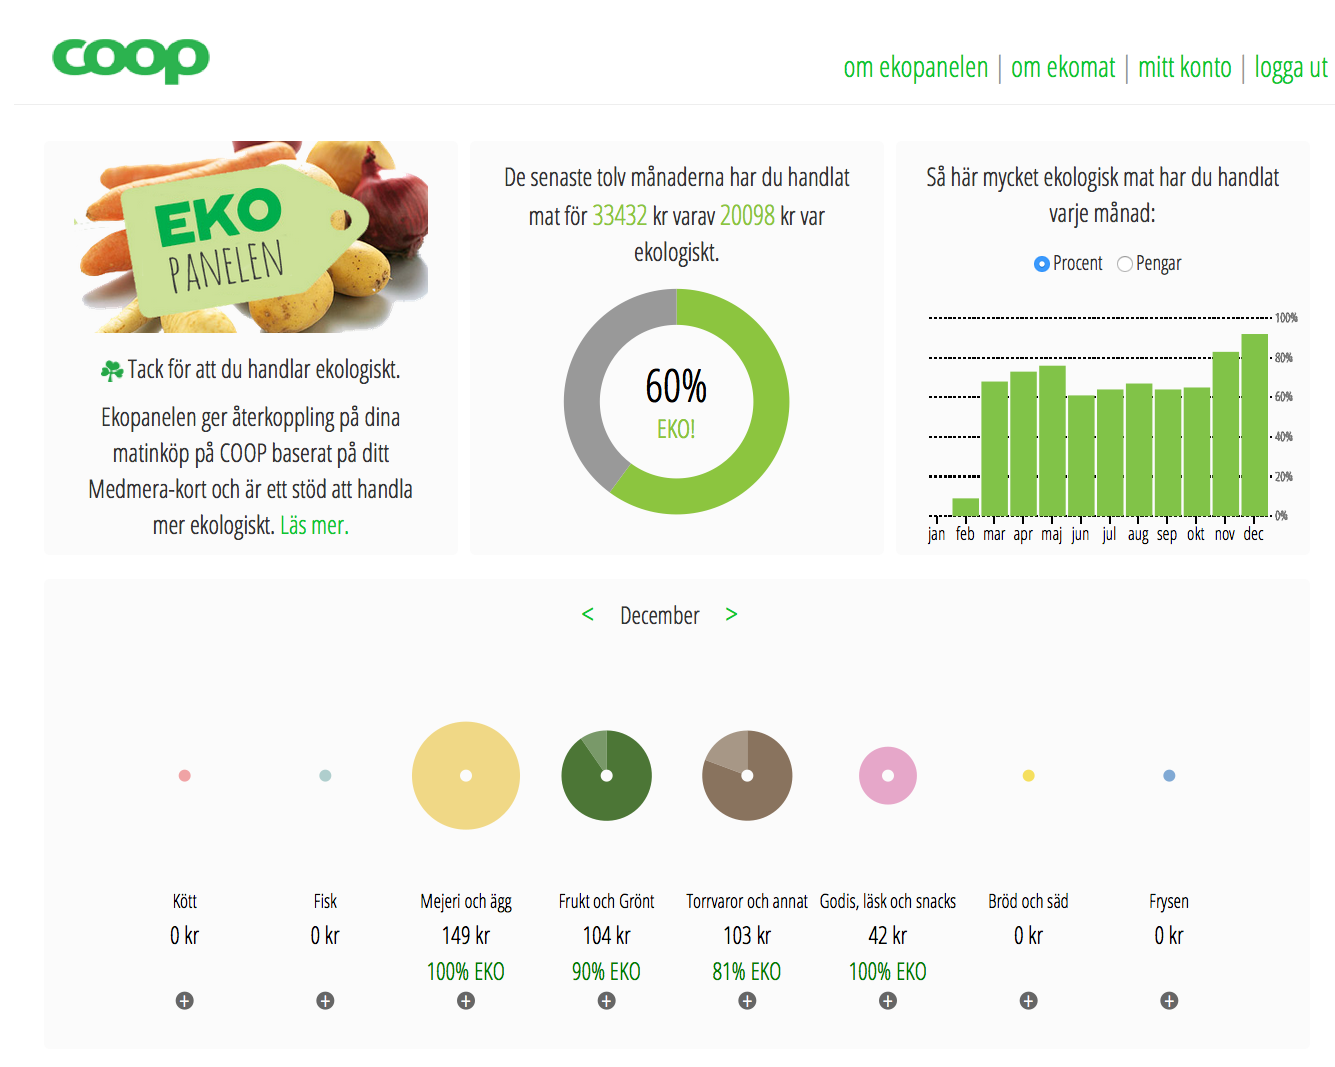
Ekopanelen explored the visualization of food consumption data for increasing organic purchases. There is a gap between willingness to buy organic food and actual buying behavior, one part of this is that consumers do not get long term feedback on their consumption so the gap is not visible. Ekopanelen used purchase data from supermarket fidelity card to visualise purchases for up to one year. The results from the prototype test pointed that users that overestimated their organic purchases increased after the feedback. In collaboration with COOP and together with Cecilia Katzeff, Ulrica Bohné and Rebecka Milestad. Development with help of Lampros Dragomoris and Mhretab Kidane.
In my PhD titled “Hacking for Sustainability” at The Royal Institute of Technology (KTH), I synthesise my work exploring the use of data in sustainability performed at the Centre for Sustainable Communications from 2009-2013. A key argument is in looking at the possibilities of information and communication not only
Green Hackathon was a series of hackathons focusing on sustainability issues and open innovation. The Green Hackathon was started together with Hannes Ebner. The first event in Stockholm 2011 at the old nuclear reactor under KTH (!) was a success, and several events were organised during the years afterwards from London to Tokyo, both by ourselves, with our support, or independently.
>
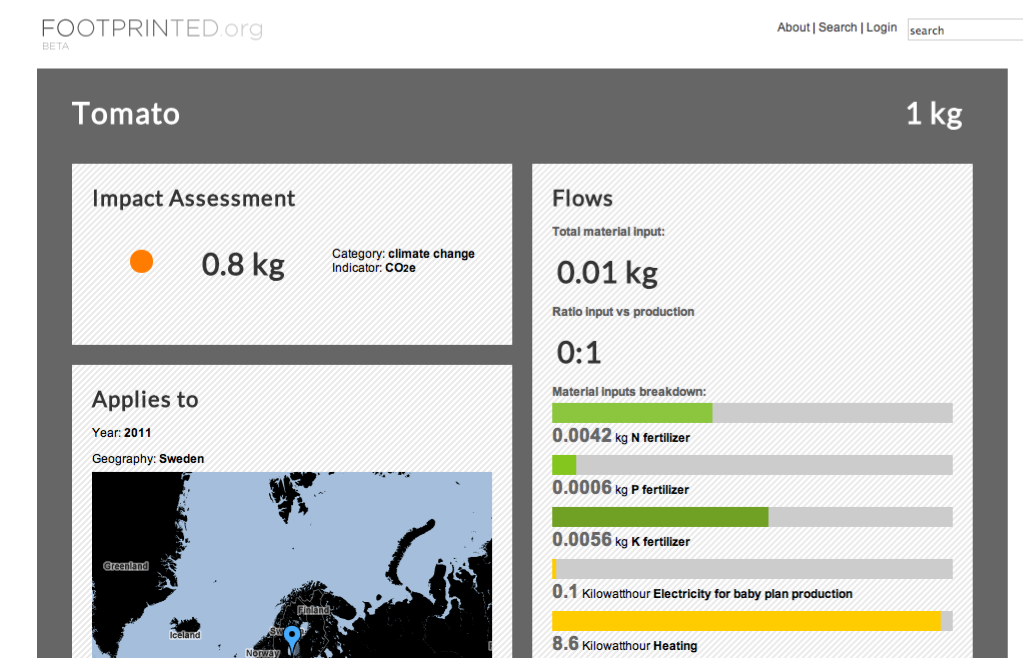
As visiting PhD at MIT Media Lab I worked on creating a repository for Life Cycle Inventory data integrated in Sourcemap. Footprinted explored how open data, linked data and APIs could be used for creating dynamic LCAs with better data traceability. Work in collaboration with Bianca Sayan and Leonardo Bonanni.
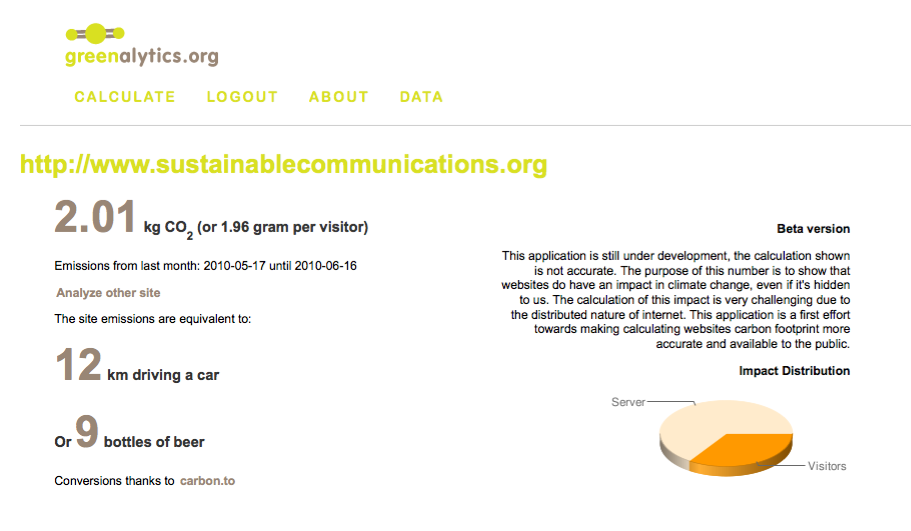
Greenalytics was a service that used Google Analytics API to calculate the energy and carbon impact of websites. Greenalytics was an exploration of how carbon impact can be calculated using bottom-up mashup approaches instead of traditional environmental impact analysis.
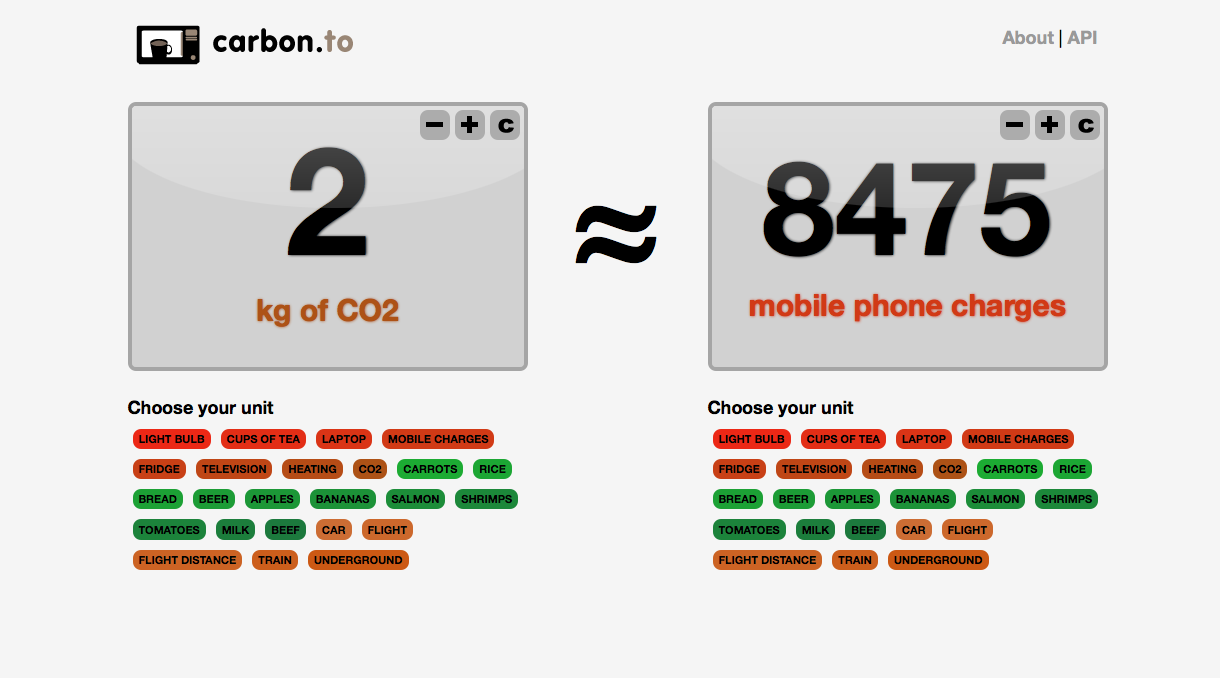
Carbon.to is a website that let users compare kilograms of CO2 against different everyday actions. The idea is to create anchors to get an understanding of the scale of emissions which can be difficult to understand when presented as the weight of an invisible gas. The users can also compare the emissions of different actions against each other, to get a grip of differences in scale. Carbon.to was created at the Ecomo hackathon with David Kjelkerud and Henrik Berggren.
